Modeling The Spectral Energy Distribution of Low Luminosity Active Galactic Nuclei
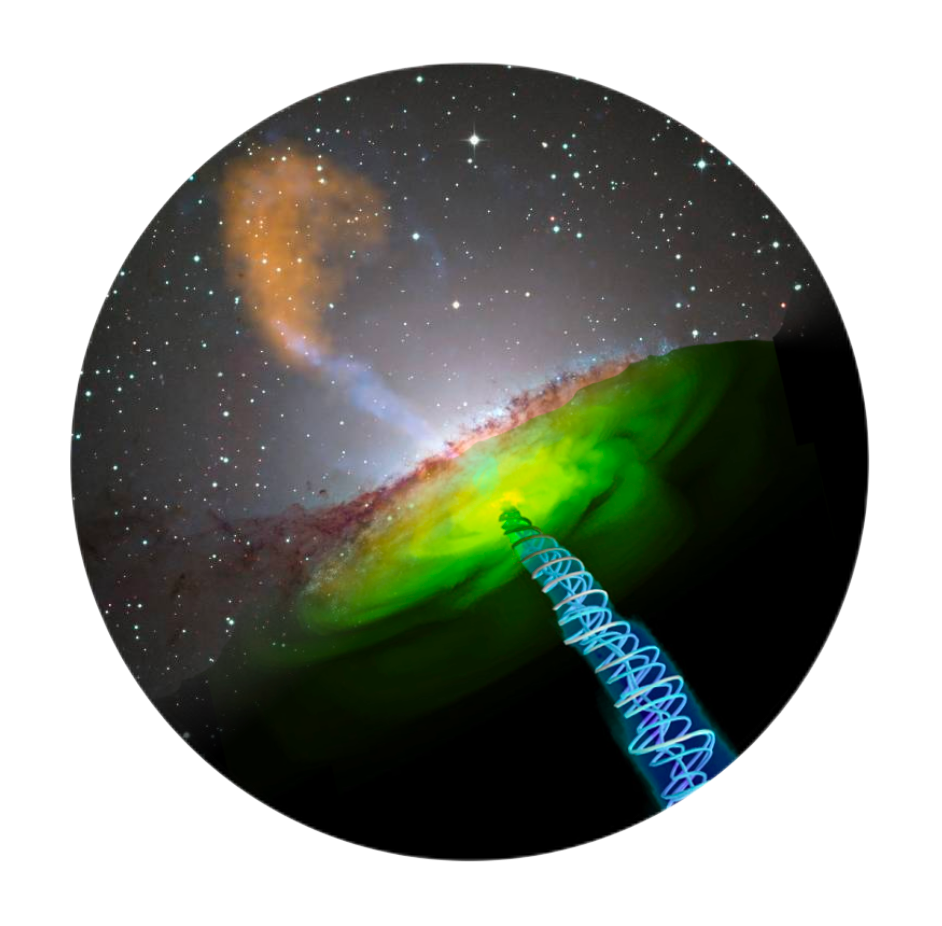
Feedback is a crucial ingredient to correctly predict galaxy evolution in cosmological simulations.Recent studies show that the most numerous class of AGNs in the local universe are low luminosity AGNs (LLAGNs), whose dominant energy output is likely carried by jets: collimated outflows of energetic particles, which could even exceed the feedback of supernovae.In contrast to the unified scheme for AGNs, where it is believed that around the black hole forms an accretion disc and further outside a torus, LLAGNs seem to show none of them. How then do the central engines receive energy? Which effects are triggering the launch of jets and provide their power? The ongoing processes seem to be fundamentally different to "normal" AGNs.
Despite the lack of knowledge about the full physical picture, a scaling relation of black holes over the entire mass-range is a starting point for developing numerical models; specifically in the case of LLAGNs models of jet-like outflows.In this thesis a semi-analytical numerical model, focusing on jet emission, is applied to a sample of three nearby LLAGNs, whose observational spectra consist out of highest angular resolution images available over nearly 10 orders of magnitude in frequency.For all sources the emission of a compact jet gives an excellent representation of the continuum emission over the entire spectrum.
Extending the number of objects investigated with this technique, will provide a better understanding of the radiative and kinetic energy output of LLAGNs.
This can be used in future cosmological simulations to improve the modelling of especially the late stage of galaxy evolution.
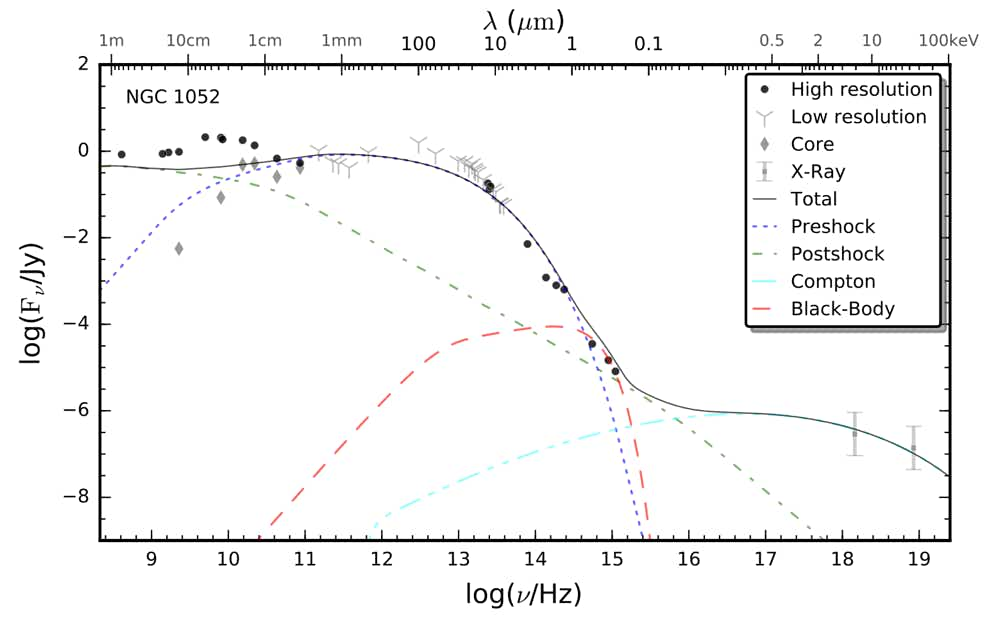
The panel displays the specific flux density (Jy) versus the frequency (Hz).
Black dots are the sub-arcsec resolution measurements. The X-ray data is indicated by the grey squares, their bars span one order of magnitude. Low angular resolution observations are represented by grey spikes.Grey diamonds display lower limits of core emission measurements.The coloured lines represent the spectrum of individual model components:
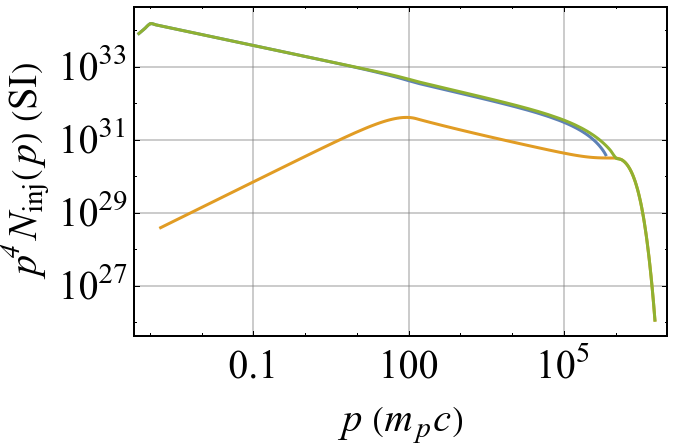
The thermal plasma at the base of the jet radiates synchrotron emission. The spectrum produced is the preshock component, represented by the dotted blue line.
Accelerated particles in the jet obey a power law energy distribution. Their synchrotron emission, the postshock component, is shown in dash-dotted green.
The energetic particles scatter up photons by the inverse Compton effect, giving rise to the Compton component (dash-dash-dotted cyan). The thermal spectrum of the truncated accretion disc is represented by the dashed red line. The model spectrum, the solid-thin black line, corresponds to the sum of all the components.
Lennart Reb
Lennart Reb: Thesis